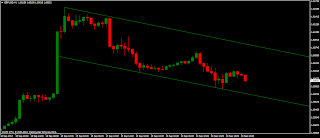
Showing posts with label DAILY FOREX ANALYSIS. Show all posts
Saturday, 21 September 2013
Thursday, 1 August 2013
GBP/USD ANALYSIS 8/2/2013
Price opened below pivot point so it is initially bearish, price is below short and long term SMA's so it is bearish, it is below middle band and rsi is also below midpoint. so it is bearish today. no trade for me today.
On fundamental side both UK is doing good, and USA is doing great.
Wednesday, 31 July 2013
GBP/USD ANALYSIS 8/1/2013
TECHNICAL STUDIES: DAILY PIVOT POINT, MOVING AVERAGES, BOLLINGER BANDS, RSI, FIBONACCI RETRACEMENT
Price opened above pivot point today so it is initially bullish sign but it has dropped below pivot point at the time of typing this analysis. SMA5 has made dead cross with SMA10, price is below SMA5,10 & 15. Price has dropped below long term averages SMA50&100 so moving averages are bearish.
Cable has tested middle band and is above middle band, but it looks weak weak support. Bollinger bands are contracting, RSI is below its midpoint. 61.8% FIB of 1.575-1.4812 proved strong resistance, fall from there could not get support on 50%, price fell below 38% but didnot close under it. So I will be looking this leve 1.5168.
FIB 1.4811-1.5432, its 50% level 1.5119 is also one important level for today.
Overall I am bearish today.
Important levels to watch today
Support 1.5168,1.5119,
CONTACT: newtraders01@gmail.com
Sunday, 28 July 2013
DAILY FOREX ANALYSIS 7/29/2013
PAIR: GBPUSD
TECHNICAL STUDIES: DAILY PIVOT POINTS, MOVING AVERAGES, BOLLINGER BANDS, RSI, FIBONACCI RETRACEMENT
DAILY PIVOT POINTS: PP 1.5381, Price opened below PP so it is bearish.
Moving Averages 5,10&15: SMA5 1.5360, SMA10 1.5301, SMA1.5218. SMA10 is untested for 9 days.
SMA5 is straight, SMA10&15 are moving in upward direction.
Moving Averages50,100&200: SMA50&100 are supporting price and SMA200 is providing resistance and it is dropping.
Bollinger Bands: Price is above middle band, Bollinger Bands are expanding.
RSI: RSI is at 55 and droping.
Fibonacci Retracement: price is between fib 61&50%.
BIAS: Keeping in view price below PP and has opened around SMA5. SMA10 is also untested for 9 days so technically I am bearish on this pair.
FUNDAMENTAL: GBP USD NEWS
GBP:
Net Lending to individuals m/m expected 1.4B
M4 Money Supply m/m expected 0.2%
Mortgage Approvals expected 60K
CBI Realised Sales expected 11
RISK: There are some high profile news release this week and will heavily influence direction of market.
CONTACT: newtraders01@gmail.com
Friday, 26 July 2013
DAILY FOREX ANALYSIS 7/26/2013
PAIR: GBPUSD
TECHNICAL STUDIES: DAILY PIVOT POINTS, MOVING AVERAGES, BOLLINGER BANDS, RSI, FIBONACCI RETRACEMENT:
DAILY PIVOT POINT: Price opened 1.5388 above pivot point 1.5361.So it is bullish start.
MOVING AVERAGES(5,10,15): SMA5 1.5359, SMA10 1.5274, SMA15 1.5190. SMA 5,10& 15 are below price and are moving in upward direction. SMA10 is untested for 7 days.
MOVING AVERAGES(50,100,200): SMA50 1.5293, SMA100 1.5280 ae below price and are providing support. SMA200 1.5565 is resistance.
BOLLINGER BANDS: Bollinger Bands are expanding , upper band is moving higher and lower band is moving lower.
RSI: RSI is at 56.
FIBONACCI RETRACEMENT: 1.5748-1.4812. yesterday price broke 61.8% resistance and closed below it. At the moment it is below 61.8% resistance.
BIAS: My bias is bullish today.
RISK: 61.8% fib has proved strong resistance, price has to break it to continue its upward direction.
CONTACT: newtraders01@gmail.com
Wednesday, 24 July 2013
DAILY FOREX ANALYSIS 7/23/2013
PAIR: GBPUSD
TECHNICAL STUDIES: Daily Pivot Points, Moving Averages(5,10,15,50,100,200), Bollinger Bands, RSI.
Daily Pivot Points: PP 1.5362. Open 1.5365. It opened today just above pivot point, so I am neutral from pivot point.Moving Averages (5,10,20): SMA5 1.5315, SMA10 1.5223, SMA15 1.5140. Moving averages are below price, and are moving in upward direction SMA5&SMA10 have crossed middle band. SMA5 is untested for last 3 days.
Moving Averages(50,100,200): SMA50 1.5288, SMA100 1.5273, SMA200 1.5573. SMA50&100 are below price and are providing support, SMA200 is resistance.
Bollinger Bands: Bollinger Bands are expanding, upper band in upward direction and lower band in lower direction. middle band is still straight. Price is above middle band so it is bullish.
RSI: RSI is 57 and its bullish.
Bias: My bias is technically Bullish as price is supported by SMA5,10,15,50,100, and middle bollinger band.
Risk: Yesterday it did not move much, remained between PP & R1. And opened just at PP. So is it losing bullish momentum? I have to see today.
Trade Plan:
Bullish above: 1.5400
Bearish below:1.5334
CONTACT: newtraders01@gmail.com
Monday, 22 July 2013
DAILY FOREX ANALYSIS 7/23/2013
PAIR: GBPUSD
TECHNICAL STUDIES: Daily Pivot Points, Moving Averages (5,10,15,50,100,200), Bollinger Bands, RSI.
Daily Pivot Points: PP 1.5333, R1 15.409, S1 1.5283. price opened above pivot point so it is bullish today.
Moving Averages: SMA5 1.5281, SMA10 1.5195, SMA15 1.5132 are rising and providing support. SMA50 1.5285, SMA100 1.5289 are below price providing support. SMA200 1.5577 is resistant point.
Bollinger Bands: Price is above middle band so it is bullish.
RSI: RSI reading is 56 in bullish zone.
BIAS: Today my bias is bullish.
Risk: Technically i don't see any risk today. SMA200 can provide strong resistance but we might not test it today.
Trade Plan:
Buy above 1.5409
sell below 1.5283
CONTACT: newtraders01@gmail.com
Sunday, 21 July 2013
DEAILY FOREX ANALYSIS 7/22/2013
PAIR: GBPUSD
Technical Studies: Daily Pivot Points, Moving Averages, Bollinger Bands, RSI,
Daily Pivot Point: PP 1.5244, Open 1.5268, above pivot so bullish start.
Moving Averages: SMA5 1.5223, SMA10 1.5137,SMA15 1.5113. SMA's are moving in upward direction. SMA10 has 4 days laging. SMA5 has golden crossover with SMA10, SMA15 and SMA20. SMA's are bullish.
Bollinger Bands: Bollinger Bands are contracting, uper, middle and lower all are in straight direction. Bollinger Bands are neutral
RSI: RSI reading 52, so RSI is bullish.
Overall bias: Bullish.
Risks: SMA 50,100 can provide resistance.
Trade Plan:
Bullish above:1.5293
Bearish below:1.5208
CONTACT: newtraders01@gmail.com
Friday, 19 July 2013
DAILY FOREX ANALYSIS 7/19/2013
PAIR: GBPUSD
Technical Studies: Daily Pivot Point,Moving Averages,Bollinger Bands,RSI
Daily Pivot Point: Price opened above pivot point.
Moving Averages: SMA5 1.5173, SMA10 1.5097 ,SMA15 1.5104, all SMA's are below price and are moving in upward direction.
Bollinger Bands: price is above middle band, bollinger bands are contracting.
RSI: RSI is at 50.
Bias: My bias is developing bullish, but still their is downward risk.
Trade Plan.
Bulllish above: 1.5253
Bearish below:1.5167
CONTACT: newtraders01@gmail.com
Wednesday, 17 July 2013
DAILY FOREX ANALYSIS 7/18/2013
Pair: GBPUSD
Technical studies: Daily Pivot Point, Moving Averages, Bollinger Bands, RSI.
Daily Pivot Points: Cable opened above pivot point.
Moving Averages: SMA 5,10&15 are below price and moving in straight direction. SMA5 1.5153, SMA10 1.5105, SMA15 1.5066.
Bollinger Bands: Price is above middle band. Lower band is moving upward, while upper and middle are downward. Bollinger Bands are contracting.
RSI: 49.
Bias: Daily bias is neutral.
If price goes above 1.5293 I will be bullish, and f it goes below 1.5104 I will be bearish
Contact: newtraders01@gmail.com
DAILY FOREX ANALYSIS 7/17/2013
Pair: GBPUSD
Technical Studies: Daily Pivot Points, Moving Averages, Bollinger Bands, Relative Strength Index.Daily Pivot Point: Cable opened above pivot point 1.5122.
Moving Averages 5,10&15: SMA5 1.5140, SMA10 1.5047& SMA15 1.5105. There is golden cross on SMA5&10, and new golden cross has developed on SMA5&15.
Bollinger Bands: Bollinger Bands are contracting, lower band is moving upward, while upper and middle are lower.
Relative Strength Index: RSI is at 49, and moving upward
Bullish momentum is developing, but still need to mature.
Trade Plan:
Bulish above:1.5201
Bearish below:1.5077
Contact: newtraders01@gmail.com
Tuesday, 16 July 2013
Daily Forex Analysis 7/16/2013
Pair: GBPUSD
Technical Studies: Daily Pivot Points, Moving Averages, Bollinger Bands, Relative Strength Index.
GBPUSD opened at 1.5098, above Daily Pivot Point, SMA5 is it 1.5095, SMA10 is at 1.5051, and SMA15 1.5111 cable is trading above SMA5&10 and below SMA15. Golden cross has developed on SMA5 & 10.
Bollinger Bands are contracting, lower band is straight, upper and middle bands moving downward. Price is below middle band.
RSI is at 44.
Overall its bearish today but golden cross in SMA5&10 if sustains is initial sign of bullish momentum developing.
Trading Plan
Bearish below:1.5042
Bullish above:1.5142
Contact: newtraders01@gmail.com
Sunday, 14 July 2013
Thursday, 11 July 2013
DAILY FOREX ANALYSIS 7/12/2013
PAIR: GBPUSD
TECHNICAL STUDY: DAILY PIVOT POINTS, RELATIVE STRENGTH INDEX.
Today PIVOT POINT is 1.5133 and initial bias is bullish, RSI reading is 48 and bearish but 2 points higher and it will be in bullish zone.
TRADE PLAN:
Bullish above 1.5270
Bearish below 1.5044
TECHNICAL STUDY: DAILY PIVOT POINTS, RELATIVE STRENGTH INDEX.
Today PIVOT POINT is 1.5133 and initial bias is bullish, RSI reading is 48 and bearish but 2 points higher and it will be in bullish zone.
TRADE PLAN:
Bullish above 1.5270
Bearish below 1.5044
Wednesday, 10 July 2013
DAILY FOREX ANALYSIS 7/11/2013
PAIR: GBPUSD
TECHNICAL STUDY: DAILY PIVOT POINTS.
PP: 1.4955
S1: 1.4894
S2: 1.4784
S3: 1.4723
R1: 1.5065
R2: 1.5126
R3: 1.5236
OPEN: 1.5013
INITIAL BIAS BULLISH
BULLISH ABOVE 1.5065
BEARISH BELOW 1.4894
TECHNICAL STUDY: DAILY PIVOT POINTS.
PP: 1.4955
S1: 1.4894
S2: 1.4784
S3: 1.4723
R1: 1.5065
R2: 1.5126
R3: 1.5236
OPEN: 1.5013
INITIAL BIAS BULLISH
BULLISH ABOVE 1.5065
BEARISH BELOW 1.4894
Tuesday, 9 July 2013
DAILY FOREX ANALYSIS 7/10/2013
PAIR: GBPUSD
TECHNICAL STUDY: PIVOT POINTS
TODAY PIVOT POINT IS 1.4885, AND OPEN PRICE IS 1.4871 LOWER THEN PP,BEARISH SIGNAL.
CURRENT PRICE IS AT 1.4865. INITIAL DAILY BIAS IS BEARISH
SELL BELOW 1.4790
BUY ABOVE 1.4958
TECHNICAL STUDY: PIVOT POINTS
TODAY PIVOT POINT IS 1.4885, AND OPEN PRICE IS 1.4871 LOWER THEN PP,BEARISH SIGNAL.
CURRENT PRICE IS AT 1.4865. INITIAL DAILY BIAS IS BEARISH
SELL BELOW 1.4790
BUY ABOVE 1.4958
Subscribe to:
Posts (Atom)