
Saturday, 31 May 2014
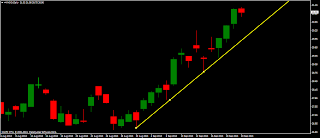
AUD/USD Analysis 31/5/2014
Saturday, 22 February 2014
Back to blogging
Its been long when I last posted on this blog. Lot of things have changed in meantime, when I started this blog I used to trade only GBP/USD . I was new in forex trading, I didnt understand markets much, importance of money management and long term trading were strange concepts to me.. but i was in process of discovery , I was learning fast. Now I am much confident about my trading. I analyse many pairs, I have become more of a fundamental trader.
Things have changed in market as well. FED is tapering it QE program. UK is growing economically but Scotland independence vote is a concern for me, Scotland choice of independence may create panic in British markets. New Zealand is expected to become 1st developed country to raise interest rates but its currency is trading at all time historical highs. will it continue to increase in value? I think it will be stable to lower over long term. Europe on average is growing, its pmi's are in expansion territory, its inflation is low, but production increase will take it higher sooner or latter. china performance hasn't been so impressive lately japan also wants to bring inflation rate to 2%. Interest rate in japan should stay at current levels for long due to its debt/gdp ratio. Increase in interest rates will effect badly on local debt. I am forecasting top ten currencies to stay at stable levels for this year. My recommendation is to buy currencies with higher interest rates, diversify your investments, and don't buy at one price. break your trade in parts and buy at different prices.
Muhammad Fazil Panhwar
Friday, 27 September 2013
Tuesday, 24 September 2013


Monday, 23 September 2013
YAHOO STOCK ANALYSIS
yahoo is technology company, listed on NASDAQ stock market.
It isin bullish trend, moving averages are making bullish pattern, there is golden crossover in moving averages 5 and 20.
rsi and bollinger bands are also in bullish pattern.


GOOGLE STOCK ANALYSIS 23-9-2013
Google is technology firm listed on NASDAQ Stock Market.
Following is stock analysis of google.
technical studies used in this analysis: TREND ANALYSIS, MOVING AVERAGES, RSI, BOLLINGER BANDS
Google is in bullish trend from 30august 2013, google stock price is above lower, middle bands, lower,middle and upper bands are in upward direction, RSI value is above its mid point, its current value is 62.
Moving average 5 and 20 are in upward direction, moving average 5 and 20 are in golden crossover.


FB ANALYSIS 23-9-2013
Face Book is a social networking site. It is listed on NASDAQ.
Below is my technical analysis of FB stock.
TECHNICAL TECHNIQUES USED IN ANALYSIS: TREND ANALYSIS, MOVING AVERAGES, RSI, BOLLINGER BANDS.
FB is in bullish trend from 15august2013, face books stock price is above middle band. lower,middle and upper bands are in rising in upward direction, RSI is above its midpoint of 50 and currently its 74 conforming strength of stock. Moving average 5 and 20 are moving in upward direction, Moving average 5 is above 20 moving average.
CONCLUSION: FB price is in bullish trend.
RECOMENDATION: buy this stock.
 |
| CHART 1 |
 |
| CHART 2 |
 |
| CHART 3 |
Saturday, 21 September 2013


Monday, 5 August 2013
gbpusd8/6/2013
Today pound is trading above moving averages and middle band, RSI is also bullish so initial bias is bullish.
Thursday, 1 August 2013
GBP/USD ANALYSIS 8/2/2013
Price opened below pivot point so it is initially bearish, price is below short and long term SMA's so it is bearish, it is below middle band and rsi is also below midpoint. so it is bearish today. no trade for me today.
On fundamental side both UK is doing good, and USA is doing great.
On fundamental side both UK is doing good, and USA is doing great.
Wednesday, 31 July 2013
GBP/USD ANALYSIS 8/1/2013
TECHNICAL STUDIES: DAILY PIVOT POINT, MOVING AVERAGES, BOLLINGER BANDS, RSI, FIBONACCI RETRACEMENT
Price opened above pivot point today so it is initially bullish sign but it has dropped below pivot point at the time of typing this analysis. SMA5 has made dead cross with SMA10, price is below SMA5,10 & 15. Price has dropped below long term averages SMA50&100 so moving averages are bearish.
Cable has tested middle band and is above middle band, but it looks weak weak support. Bollinger bands are contracting, RSI is below its midpoint. 61.8% FIB of 1.575-1.4812 proved strong resistance, fall from there could not get support on 50%, price fell below 38% but didnot close under it. So I will be looking this leve 1.5168.
FIB 1.4811-1.5432, its 50% level 1.5119 is also one important level for today.
Overall I am bearish today.
Important levels to watch today
Support 1.5168,1.5119,
CONTACT: newtraders01@gmail.com
Sunday, 28 July 2013
DAILY FOREX ANALYSIS 7/29/2013
PAIR: GBPUSD
TECHNICAL STUDIES: DAILY PIVOT POINTS, MOVING AVERAGES, BOLLINGER BANDS, RSI, FIBONACCI RETRACEMENT
DAILY PIVOT POINTS: PP 1.5381, Price opened below PP so it is bearish.
Moving Averages 5,10&15: SMA5 1.5360, SMA10 1.5301, SMA1.5218. SMA10 is untested for 9 days.
SMA5 is straight, SMA10&15 are moving in upward direction.
Moving Averages50,100&200: SMA50&100 are supporting price and SMA200 is providing resistance and it is dropping.
Bollinger Bands: Price is above middle band, Bollinger Bands are expanding.
RSI: RSI is at 55 and droping.
Fibonacci Retracement: price is between fib 61&50%.
BIAS: Keeping in view price below PP and has opened around SMA5. SMA10 is also untested for 9 days so technically I am bearish on this pair.
FUNDAMENTAL: GBP USD NEWS
GBP:
Net Lending to individuals m/m expected 1.4B
M4 Money Supply m/m expected 0.2%
Mortgage Approvals expected 60K
CBI Realised Sales expected 11
RISK: There are some high profile news release this week and will heavily influence direction of market.
CONTACT: newtraders01@gmail.com
Friday, 26 July 2013
DAILY FOREX ANALYSIS 7/26/2013
PAIR: GBPUSD
TECHNICAL STUDIES: DAILY PIVOT POINTS, MOVING AVERAGES, BOLLINGER BANDS, RSI, FIBONACCI RETRACEMENT:
DAILY PIVOT POINT: Price opened 1.5388 above pivot point 1.5361.So it is bullish start.
MOVING AVERAGES(5,10,15): SMA5 1.5359, SMA10 1.5274, SMA15 1.5190. SMA 5,10& 15 are below price and are moving in upward direction. SMA10 is untested for 7 days.
MOVING AVERAGES(50,100,200): SMA50 1.5293, SMA100 1.5280 ae below price and are providing support. SMA200 1.5565 is resistance.
BOLLINGER BANDS: Bollinger Bands are expanding , upper band is moving higher and lower band is moving lower.
RSI: RSI is at 56.
FIBONACCI RETRACEMENT: 1.5748-1.4812. yesterday price broke 61.8% resistance and closed below it. At the moment it is below 61.8% resistance.
BIAS: My bias is bullish today.
RISK: 61.8% fib has proved strong resistance, price has to break it to continue its upward direction.
CONTACT: newtraders01@gmail.com
CONTACT: newtraders01@gmail.com

Thursday, 25 July 2013
DAILY DAY END FOREX REVIEW 7/25/2013
PAIR:GBPUSD
TECHNICAL REVIEW:
Today price opened at 1.5311 below PP made low of 1.5261, and high of 1.5432. Although it broke 1.54 resistance but closed below it.
FUNDAMENTAL REVIEW:
GBP: GDP data was released of UK. It was 0.6% as forecast
USD: Core durable goods order at 0.0% against forecast of 0.5%
USD: Unemployment claims at 343K against forecast 339K
USD: Durable goods order m/m at 4.2% against forecast of 1.1%
CONCLUSION:
In my view GBP long is favorable as British economy is showing signs of improvement.
USD strength is coming from taper expectations, in my point of view data don't support early taper.
Technically GBPUSD is above bollinger bands, daily RSI is above 50, most of moving averages I follow are below price, so i am bullish on GBPUSD.
CONTACT: newtraders01@gmail.com
Wednesday, 24 July 2013
DAILY DAY END FOREX REVIEW 7/24/2013
PAIR: GBPUSD
TECHNICAL REVIEW:
Today it opened at 1.5365, made high of 1.5389 and low of 1.5287. It got resistance from 61.8% fib level and was supported at 50% fib of 1.575-1.4812. Support was also provided by 50d average at 1.5287.
There is event risk of preliminary British GDP data tomorrow. Only good data can support price and will take it above 61.8% fib.
Today range: 100 pips.
FUNDAMENTAL REVIEW:
GBP:
CBI Industrial order expectation data was released today, it was -12 as expected. It was medium impact data and came as expected so could not support GBP.
USD:
There were 3 fundamental news in USD, Flash Manufacturing PMI was 53.2 against expected 52.5
New Home Sales 497K against expected 482K.
Crude Oil Inventries -2.8M against -2.5M expected.
Fundamentals supported USD.
CONTACT: newtraders01@gmail.com
ANNOUNCEMENT
FROM TODAY I WILL BE DOING END OF DAY REVIEW OF MARKET. WILL ANALYSE MARKET BEHAVIOR AND MY ANALYSIS.
IN TECHNICAL STUDY ADDITION OF FIBONACCI RETRACEMENT WILL BE ADDED.
I WILL ALSO ADD FUNDAMENTAL ANALYSIS TO MY DAILY REPORT.
IN TECHNICAL STUDY ADDITION OF FIBONACCI RETRACEMENT WILL BE ADDED.
I WILL ALSO ADD FUNDAMENTAL ANALYSIS TO MY DAILY REPORT.
DAILY FOREX ANALYSIS 7/23/2013
PAIR: GBPUSD
TECHNICAL STUDIES: Daily Pivot Points, Moving Averages(5,10,15,50,100,200), Bollinger Bands, RSI.
Daily Pivot Points: PP 1.5362. Open 1.5365. It opened today just above pivot point, so I am neutral from pivot point.Moving Averages (5,10,20): SMA5 1.5315, SMA10 1.5223, SMA15 1.5140. Moving averages are below price, and are moving in upward direction SMA5&SMA10 have crossed middle band. SMA5 is untested for last 3 days.
Moving Averages(50,100,200): SMA50 1.5288, SMA100 1.5273, SMA200 1.5573. SMA50&100 are below price and are providing support, SMA200 is resistance.
Bollinger Bands: Bollinger Bands are expanding, upper band in upward direction and lower band in lower direction. middle band is still straight. Price is above middle band so it is bullish.
RSI: RSI is 57 and its bullish.
Bias: My bias is technically Bullish as price is supported by SMA5,10,15,50,100, and middle bollinger band.
Risk: Yesterday it did not move much, remained between PP & R1. And opened just at PP. So is it losing bullish momentum? I have to see today.
Trade Plan:
Bullish above: 1.5400
Bearish below:1.5334
CONTACT: newtraders01@gmail.com

Monday, 22 July 2013
DAILY FOREX ANALYSIS 7/23/2013
PAIR: GBPUSD
TECHNICAL STUDIES: Daily Pivot Points, Moving Averages (5,10,15,50,100,200), Bollinger Bands, RSI.
Daily Pivot Points: PP 1.5333, R1 15.409, S1 1.5283. price opened above pivot point so it is bullish today.
Moving Averages: SMA5 1.5281, SMA10 1.5195, SMA15 1.5132 are rising and providing support. SMA50 1.5285, SMA100 1.5289 are below price providing support. SMA200 1.5577 is resistant point.
Bollinger Bands: Price is above middle band so it is bullish.
RSI: RSI reading is 56 in bullish zone.
BIAS: Today my bias is bullish.
Risk: Technically i don't see any risk today. SMA200 can provide strong resistance but we might not test it today.
Trade Plan:
Buy above 1.5409
sell below 1.5283
CONTACT: newtraders01@gmail.com
CONTACT: newtraders01@gmail.com

Sunday, 21 July 2013
DEAILY FOREX ANALYSIS 7/22/2013
PAIR: GBPUSD
Technical Studies: Daily Pivot Points, Moving Averages, Bollinger Bands, RSI,
Daily Pivot Point: PP 1.5244, Open 1.5268, above pivot so bullish start.
Moving Averages: SMA5 1.5223, SMA10 1.5137,SMA15 1.5113. SMA's are moving in upward direction. SMA10 has 4 days laging. SMA5 has golden crossover with SMA10, SMA15 and SMA20. SMA's are bullish.
Bollinger Bands: Bollinger Bands are contracting, uper, middle and lower all are in straight direction. Bollinger Bands are neutral
RSI: RSI reading 52, so RSI is bullish.
Overall bias: Bullish.
Risks: SMA 50,100 can provide resistance.
Trade Plan:
Bullish above:1.5293
Bearish below:1.5208
CONTACT: newtraders01@gmail.com

Friday, 19 July 2013
DAILY FOREX ANALYSIS 7/19/2013
PAIR: GBPUSD
Technical Studies: Daily Pivot Point,Moving Averages,Bollinger Bands,RSI
Daily Pivot Point: Price opened above pivot point.
Moving Averages: SMA5 1.5173, SMA10 1.5097 ,SMA15 1.5104, all SMA's are below price and are moving in upward direction.
Bollinger Bands: price is above middle band, bollinger bands are contracting.
RSI: RSI is at 50.
Bias: My bias is developing bullish, but still their is downward risk.
Trade Plan.
Bulllish above: 1.5253
Bearish below:1.5167
CONTACT: newtraders01@gmail.com

Subscribe to:
Posts (Atom)