MY FORECAST FOR OCTOBER CLOSE IS BULLISH.
Friday, 27 September 2013
Tuesday, 24 September 2013


Monday, 23 September 2013
YAHOO STOCK ANALYSIS
yahoo is technology company, listed on NASDAQ stock market.
It isin bullish trend, moving averages are making bullish pattern, there is golden crossover in moving averages 5 and 20.
rsi and bollinger bands are also in bullish pattern.


GOOGLE STOCK ANALYSIS 23-9-2013
Google is technology firm listed on NASDAQ Stock Market.
Following is stock analysis of google.
technical studies used in this analysis: TREND ANALYSIS, MOVING AVERAGES, RSI, BOLLINGER BANDS
Google is in bullish trend from 30august 2013, google stock price is above lower, middle bands, lower,middle and upper bands are in upward direction, RSI value is above its mid point, its current value is 62.
Moving average 5 and 20 are in upward direction, moving average 5 and 20 are in golden crossover.


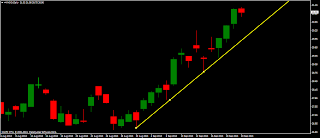
FB ANALYSIS 23-9-2013
Face Book is a social networking site. It is listed on NASDAQ.
Below is my technical analysis of FB stock.
TECHNICAL TECHNIQUES USED IN ANALYSIS: TREND ANALYSIS, MOVING AVERAGES, RSI, BOLLINGER BANDS.
FB is in bullish trend from 15august2013, face books stock price is above middle band. lower,middle and upper bands are in rising in upward direction, RSI is above its midpoint of 50 and currently its 74 conforming strength of stock. Moving average 5 and 20 are moving in upward direction, Moving average 5 is above 20 moving average.
CONCLUSION: FB price is in bullish trend.
RECOMENDATION: buy this stock.
 |
| CHART 1 |
 |
| CHART 2 |
 |
| CHART 3 |
Saturday, 21 September 2013


Subscribe to:
Comments (Atom)